Margin for IT Services & Consulting.
Per-user, per-engagement, hourly. You know the work. Margin shows you the real cost behind each model — before the contract is signed.
How IT services firms price today
IT services is the only vertical where three pricing models run side by side. Per-user or per-device for managed work. Per-engagement for migrations, deployments, and cutovers. Hourly for everything else. The same firm runs all three for the same client.
You're already pricing all three. The hard part is seeing which one is actually profitable on which account — and which one is quietly subsidizing the rest.
Where margin gets lost
- A heavy account on a flat per-user price. The price assumes an average user. When the client's average isn't your average, the seat math collapses.
- "While you're in there" requests. The migration finishes. The extras don't. Without a versioned estimate, every extra request lands in absorption.
- Architect priced, engineer delivered. You sold the engagement at architect rates. The work shipped on engineer hours. Role-level cost data makes the gap visible.
- Tooling costs that move faster than your rates. Your stack costs grow with the user count. Most firms don't reprice when the underlying tools get 20% more expensive.
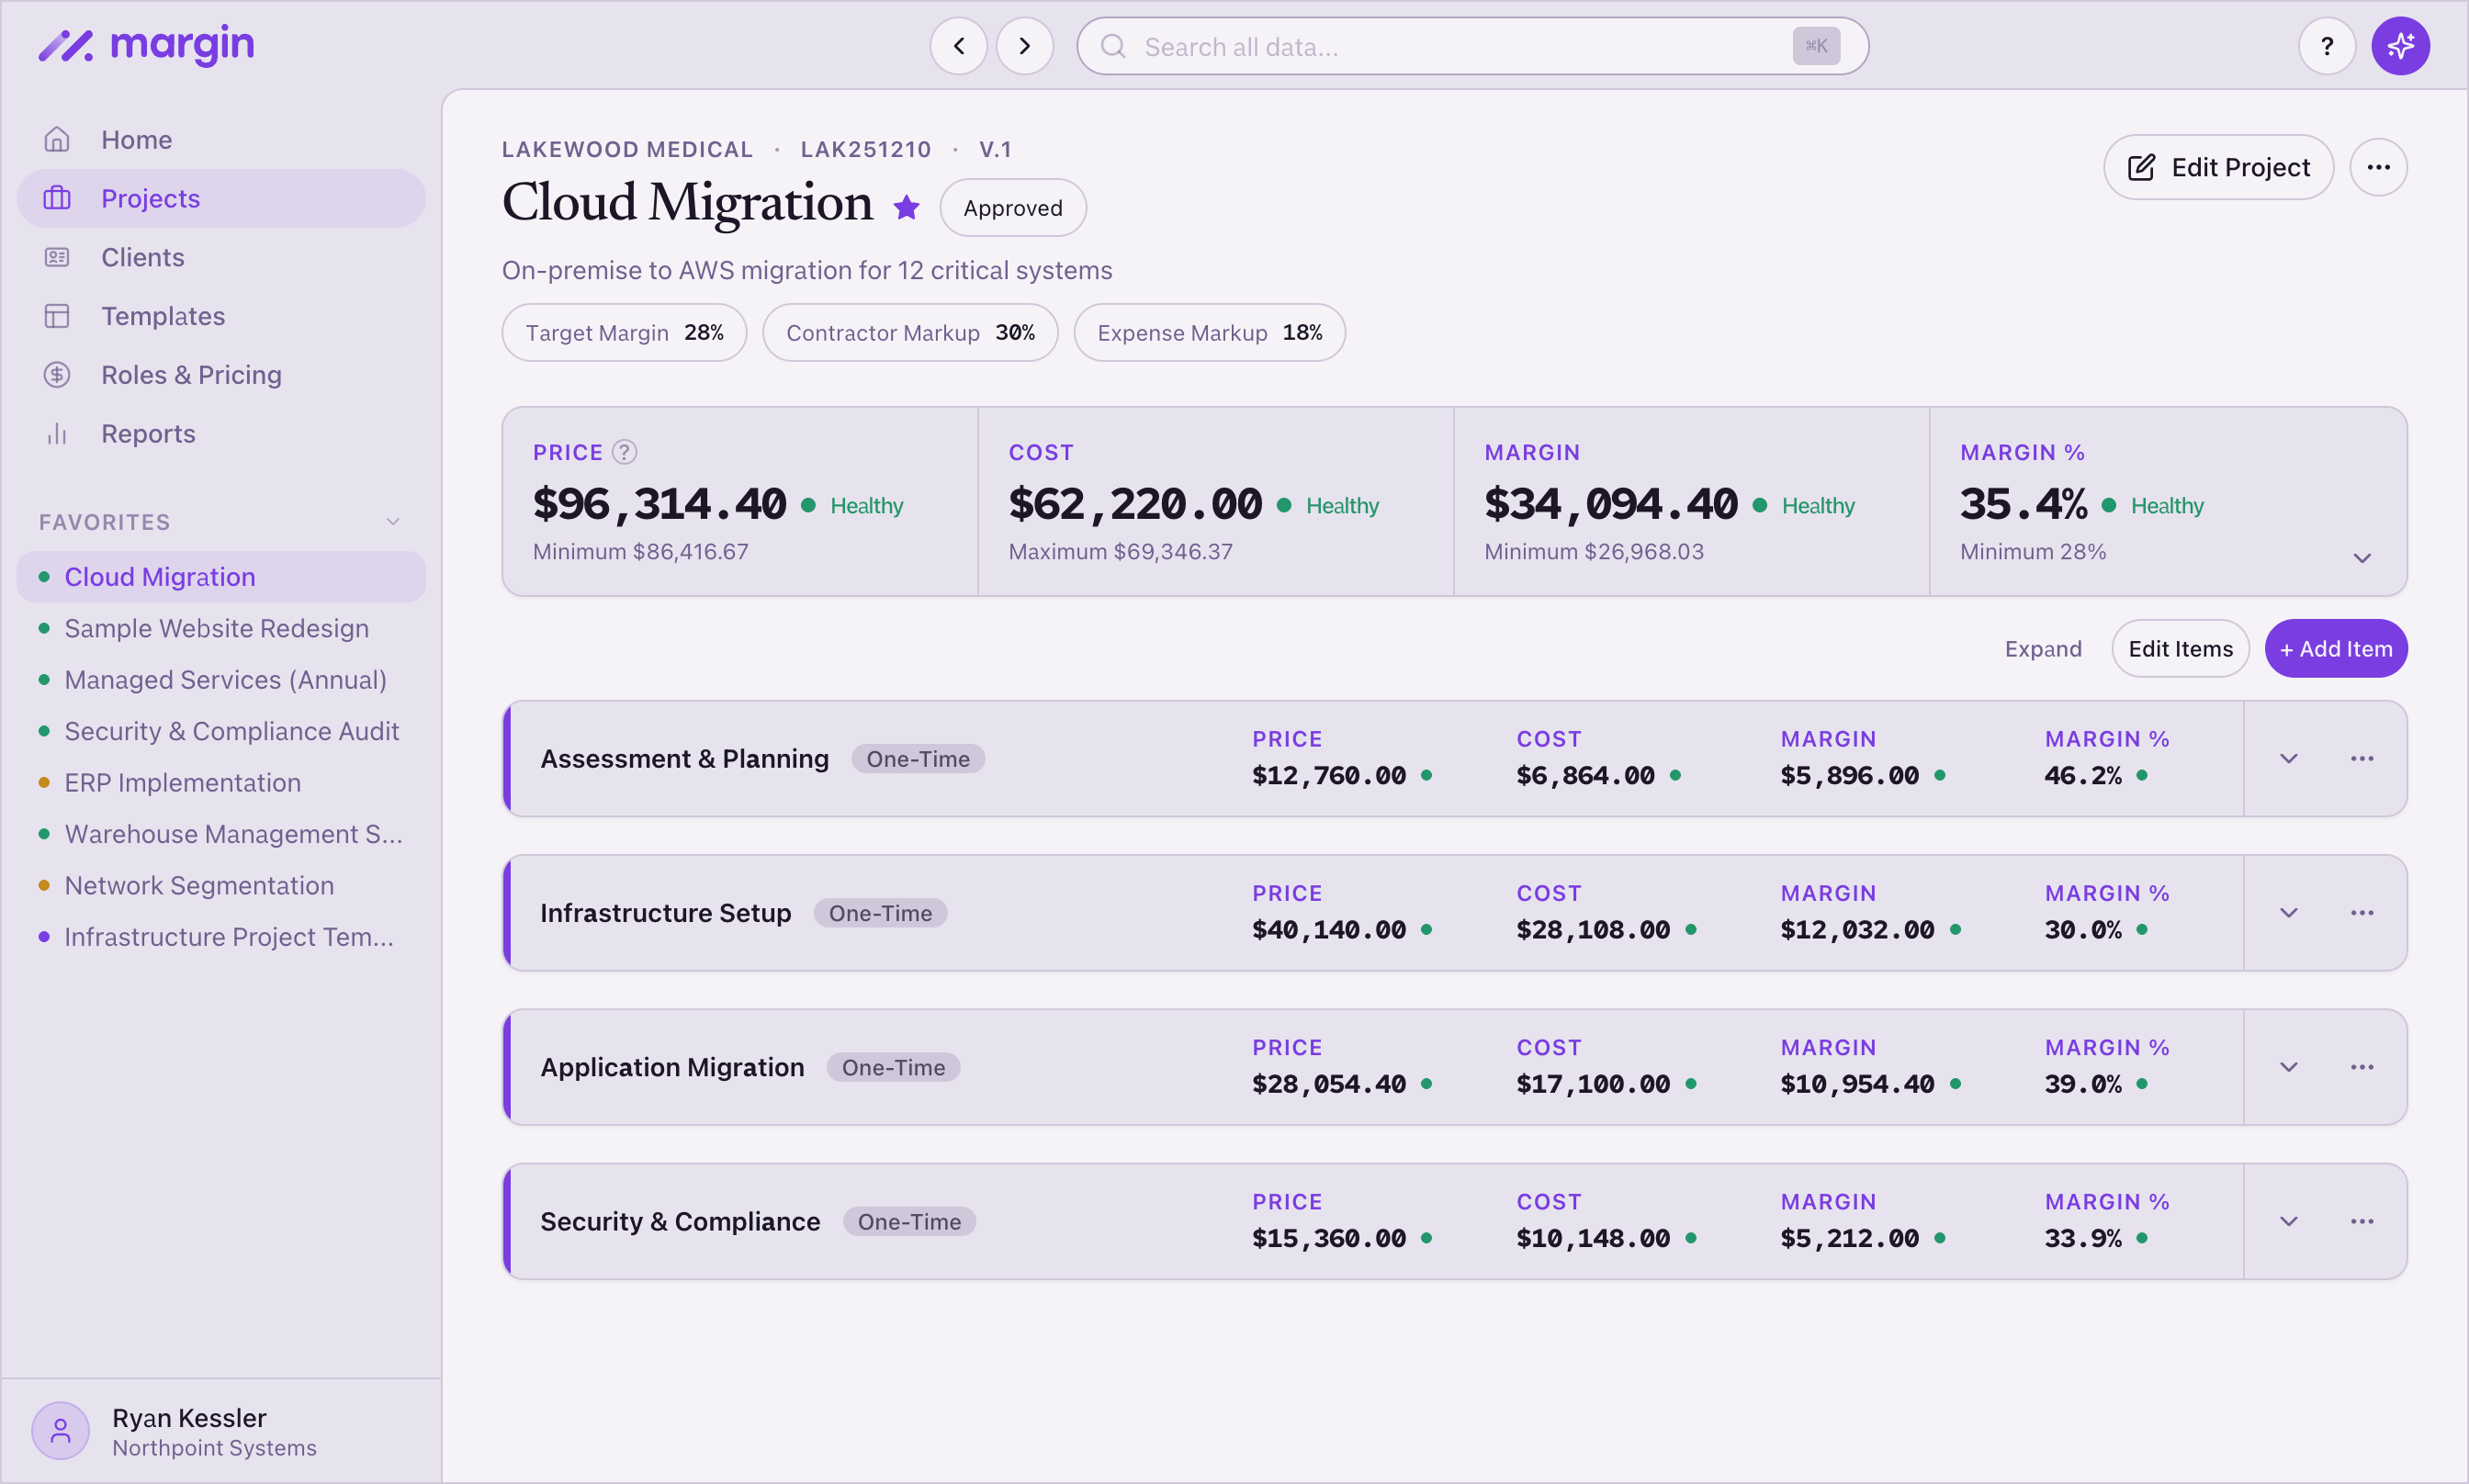
A cloud migration, priced phase by phase.
Here's a sample engagement from Margin: Lakewood Medical's on-premises to Amazon Web Services migration. Four phases — Assessment, Infrastructure, Application Migration, Security & Compliance — each with its own cost, margin, and health. The total runs $96,314 against $62,220 in cost. You see which phase is carrying the margin and which is thin.
Price every model on its real cost to serve.
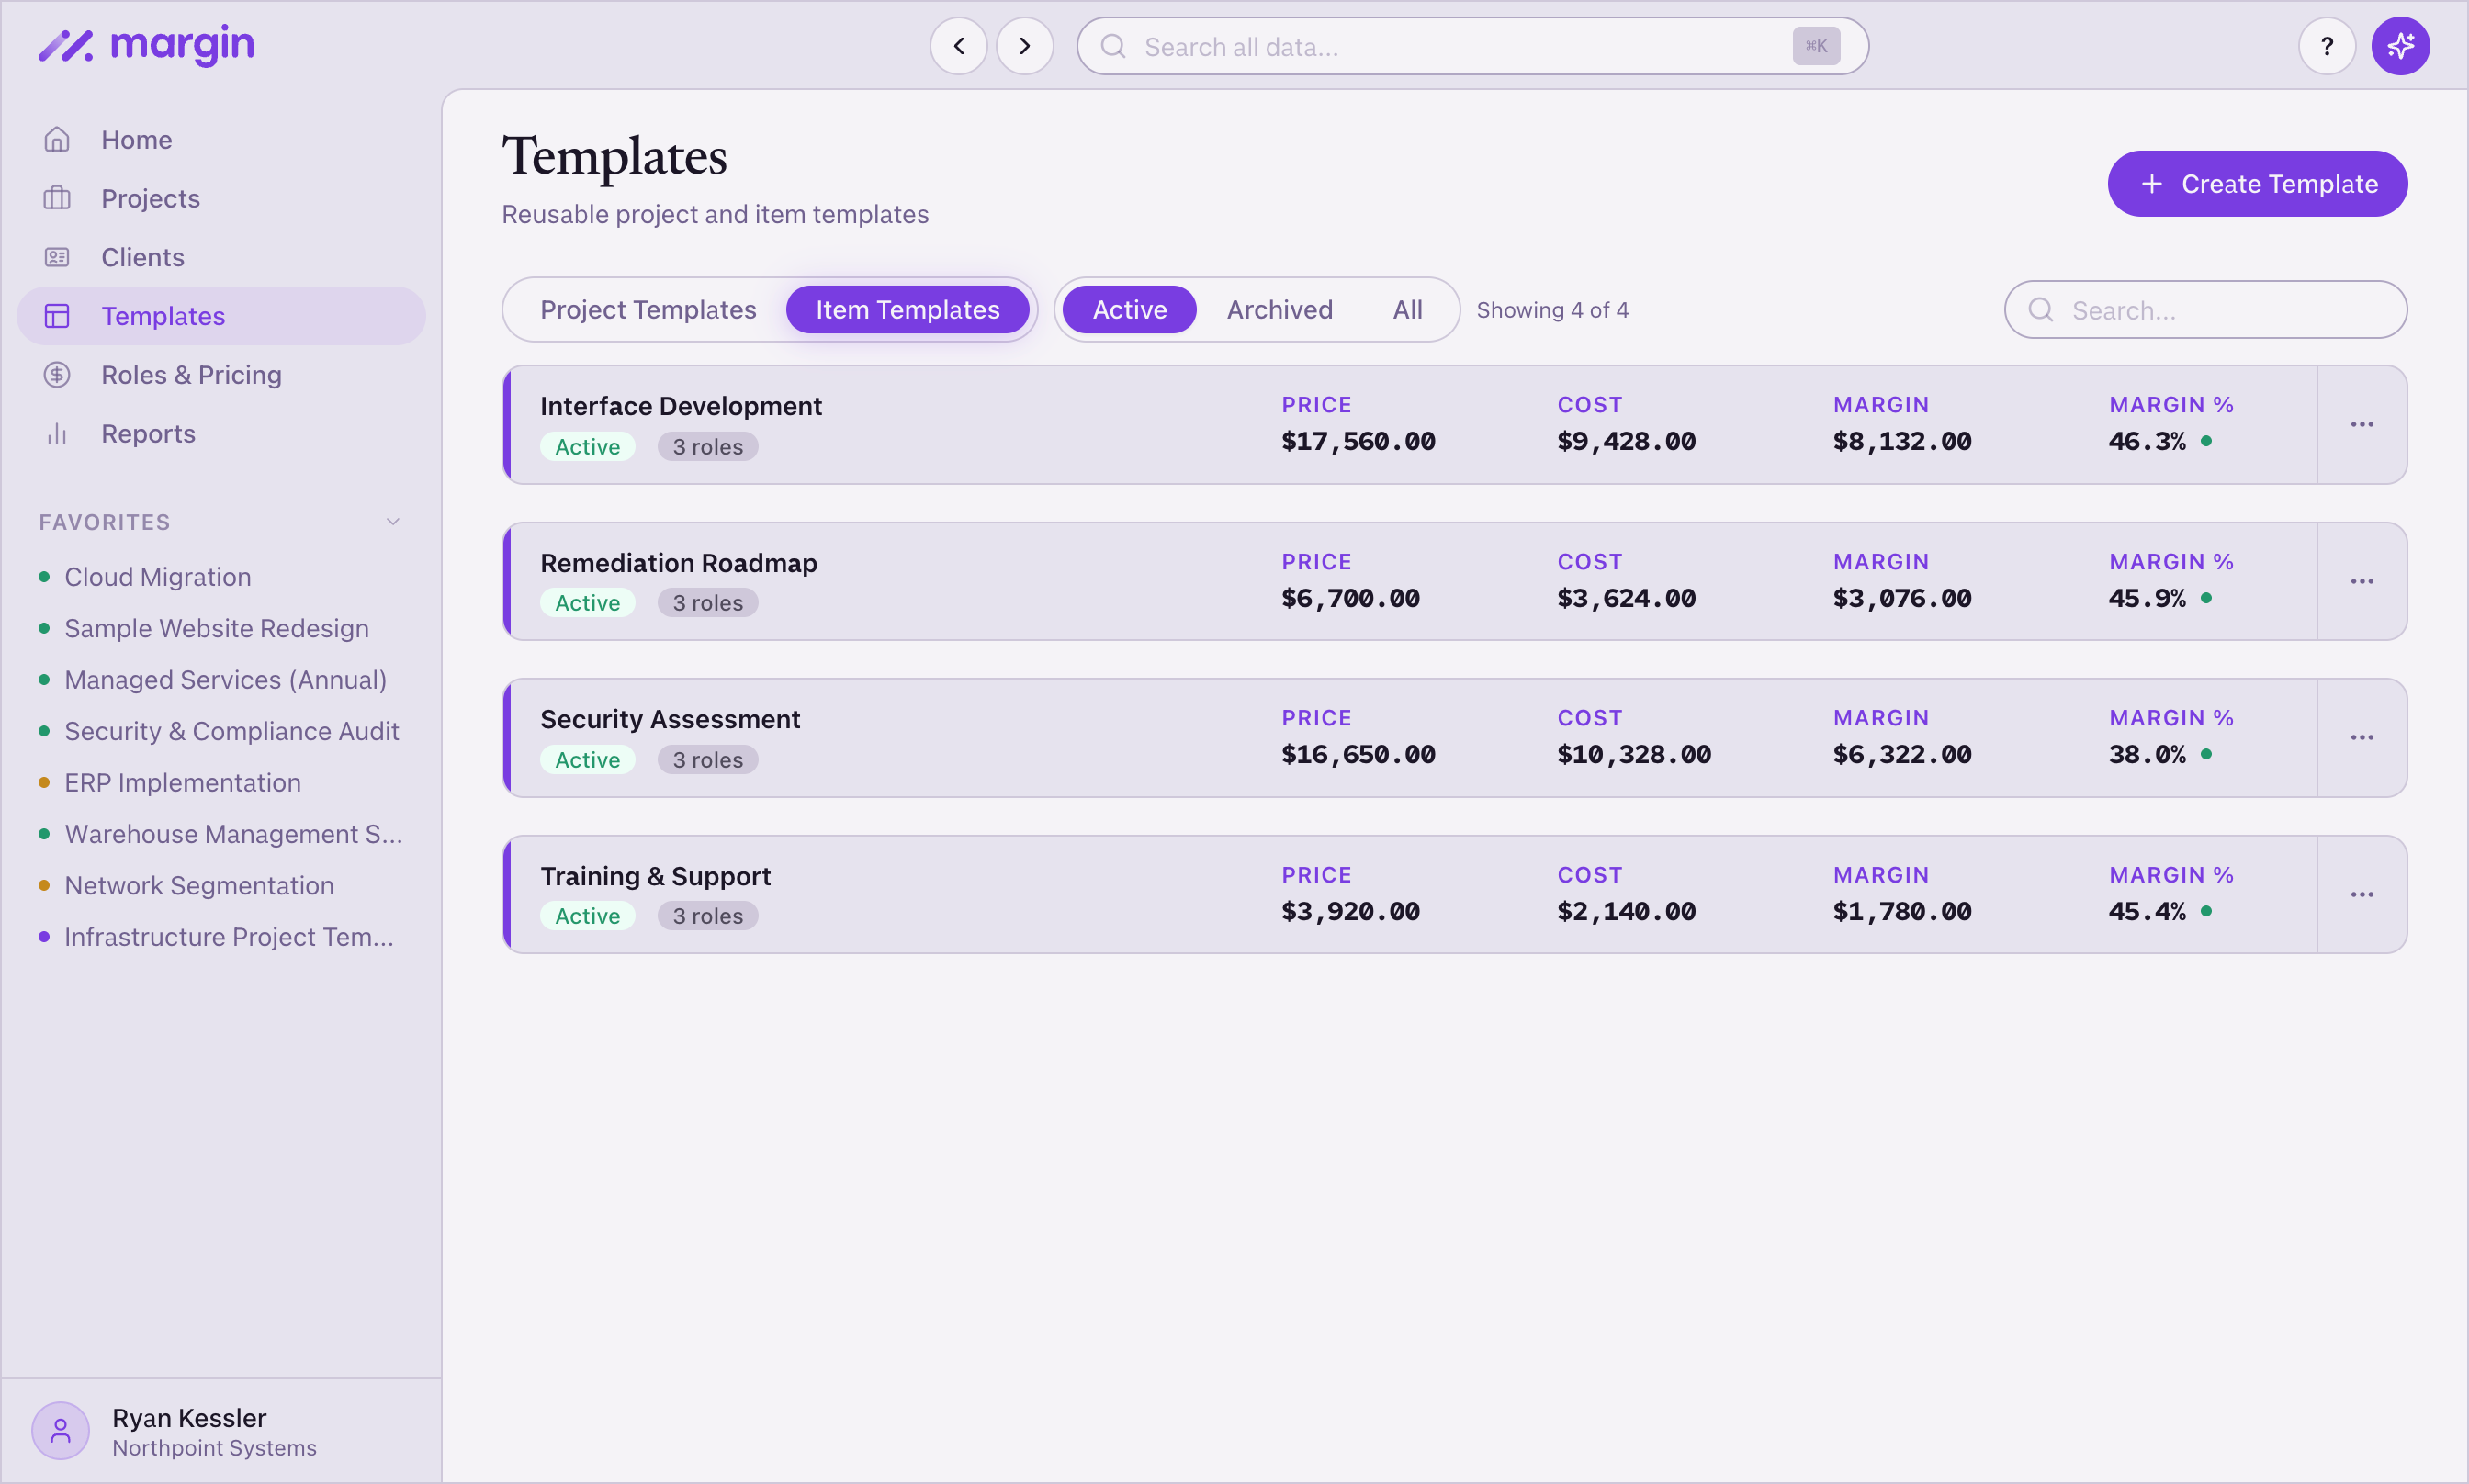
Templates for managed, project, and hourly work
Build a template for a Security Assessment, a Remediation Roadmap, an Interface Development, a Training & Support package. New work starts from the engagement type that fits — not from a blended rate that hides which model is actually profitable.
The first time you price a HIPAA remediation, you build it from scratch. The next ten times, you adapt the template, swap the client, adjust the hours. Pricing gets faster and more accurate as your library grows.
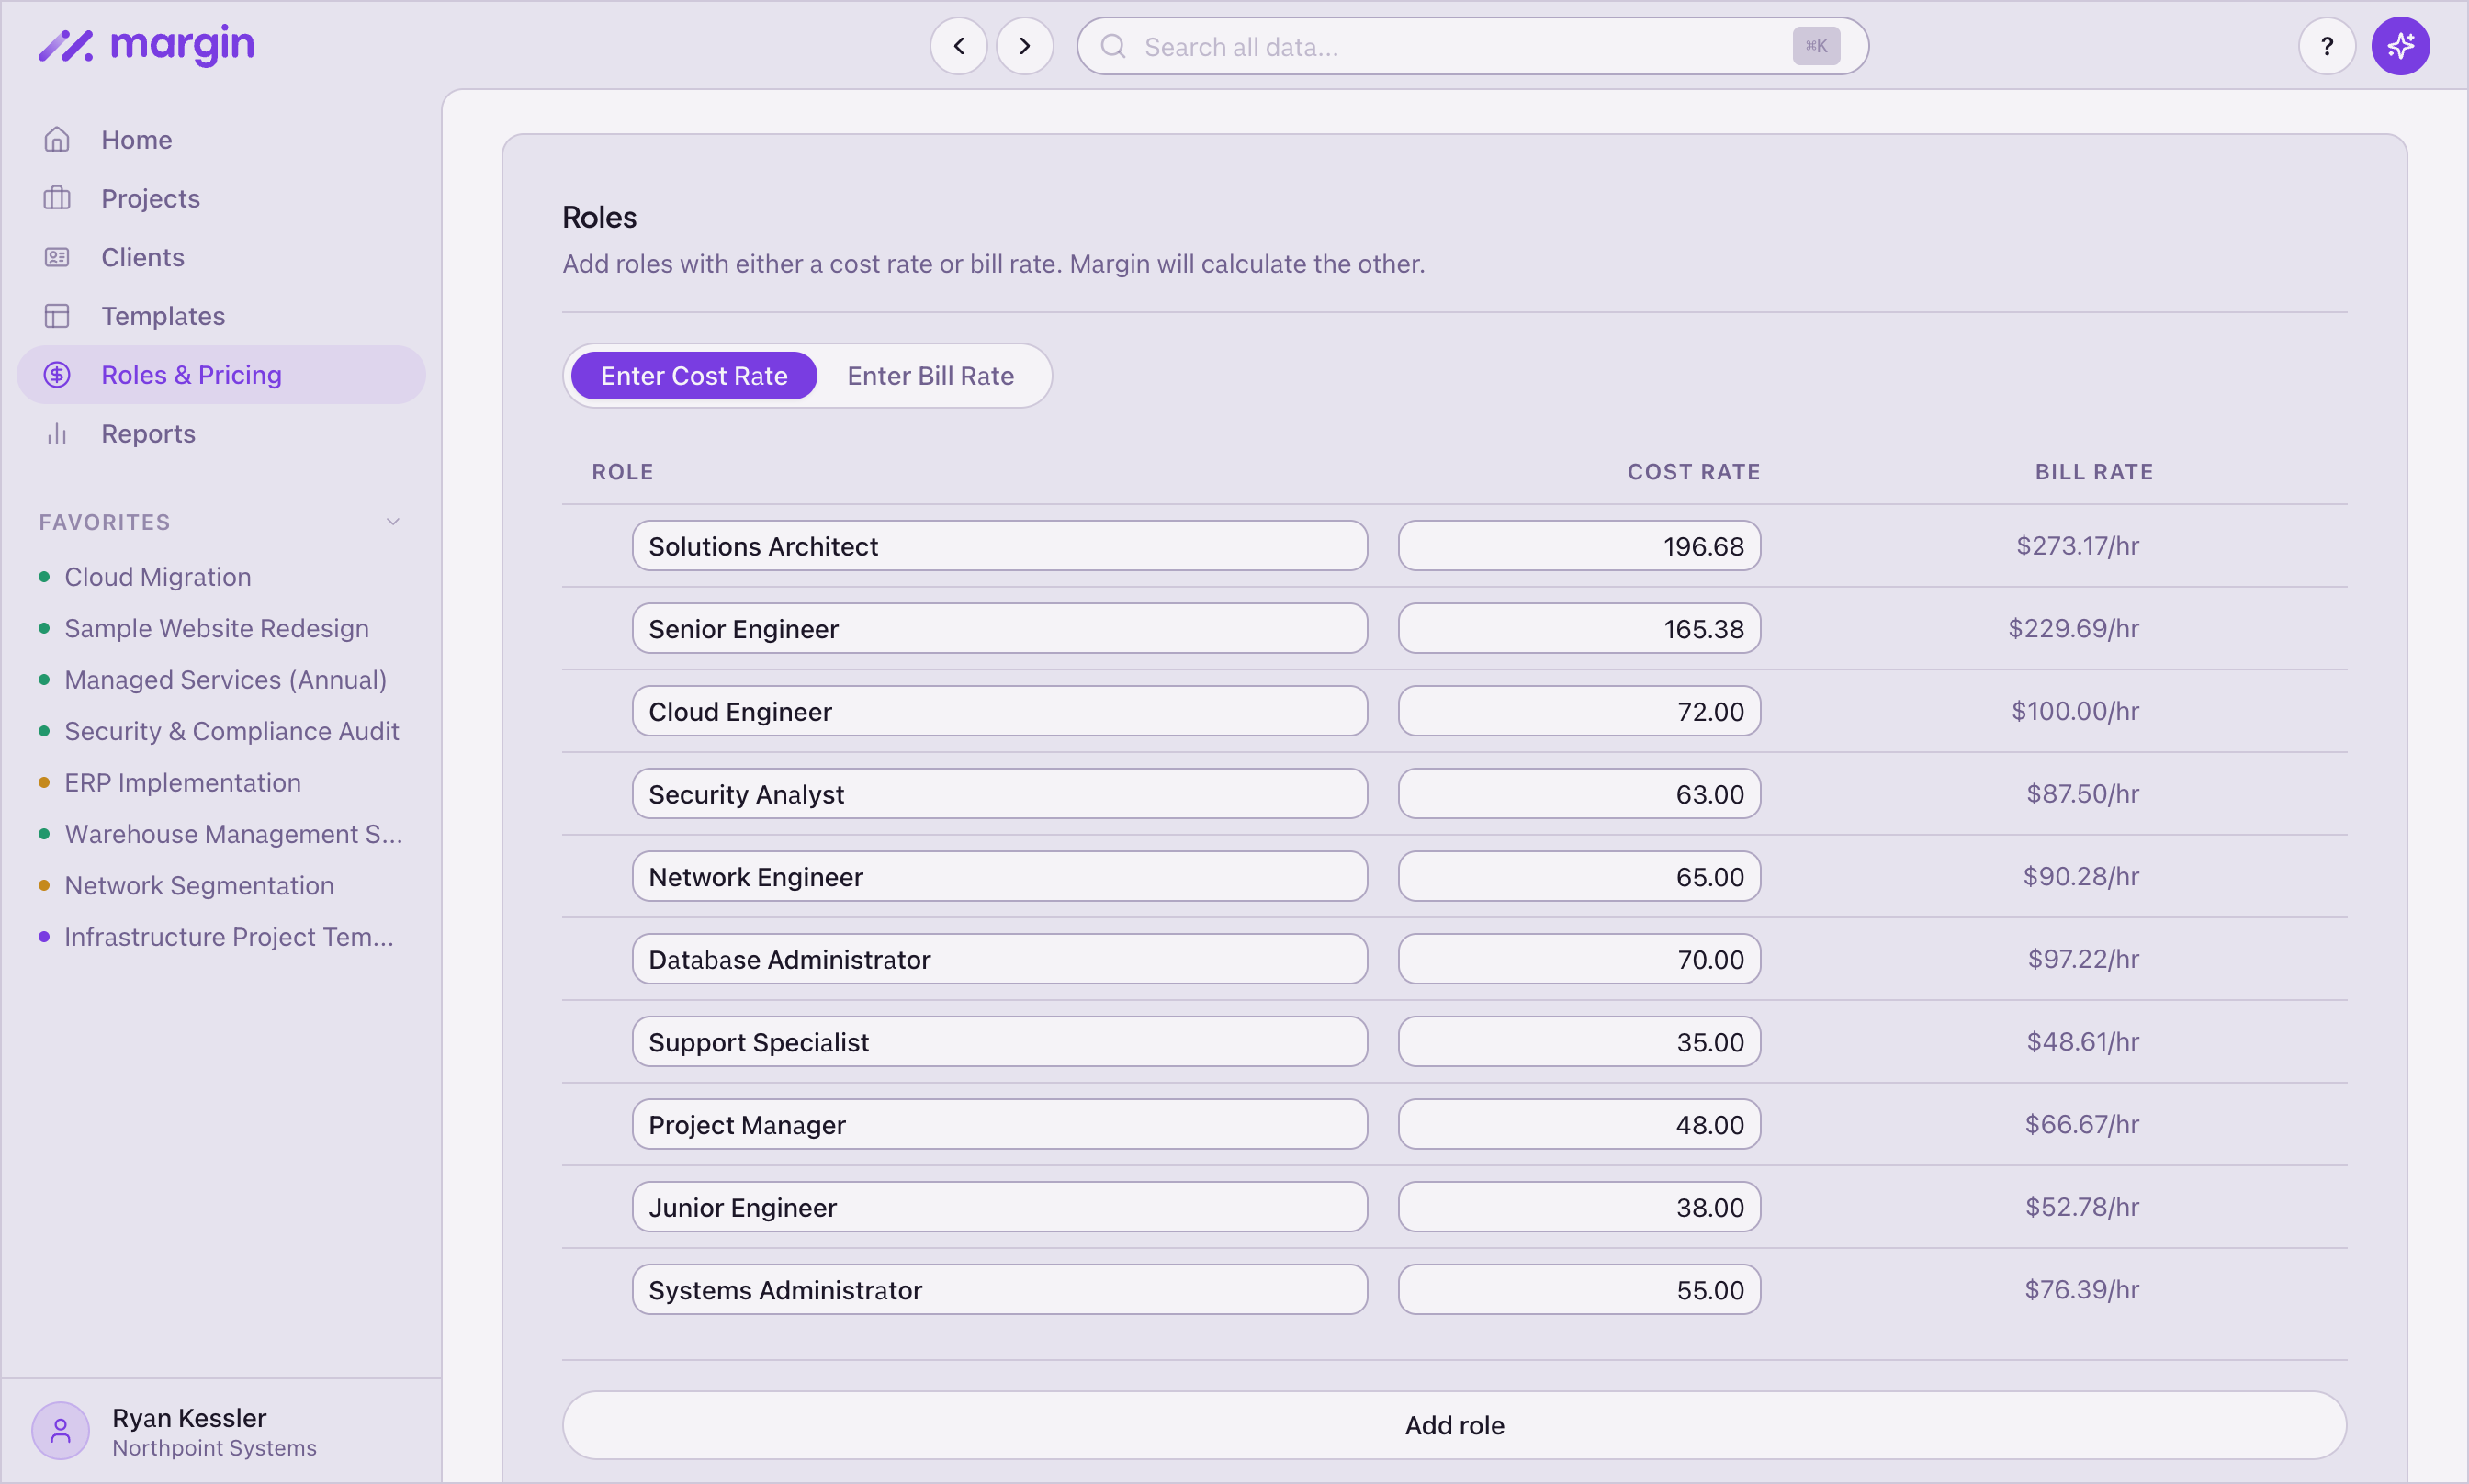
Architect, engineer, and project-manager tiers — priced on what each one costs
You set the cost rate for every role in your stack — Solutions Architect, Senior Engineer, Cloud Engineer, Security Analyst, Network Engineer, Database Administrator, Project Manager. Margin handles the bill-rate math against your overhead, non-billable time, and target margin.
When an architect runs work an engineer could handle, you see the margin move on the engagement before the change order goes out. The gap stops being invisible.
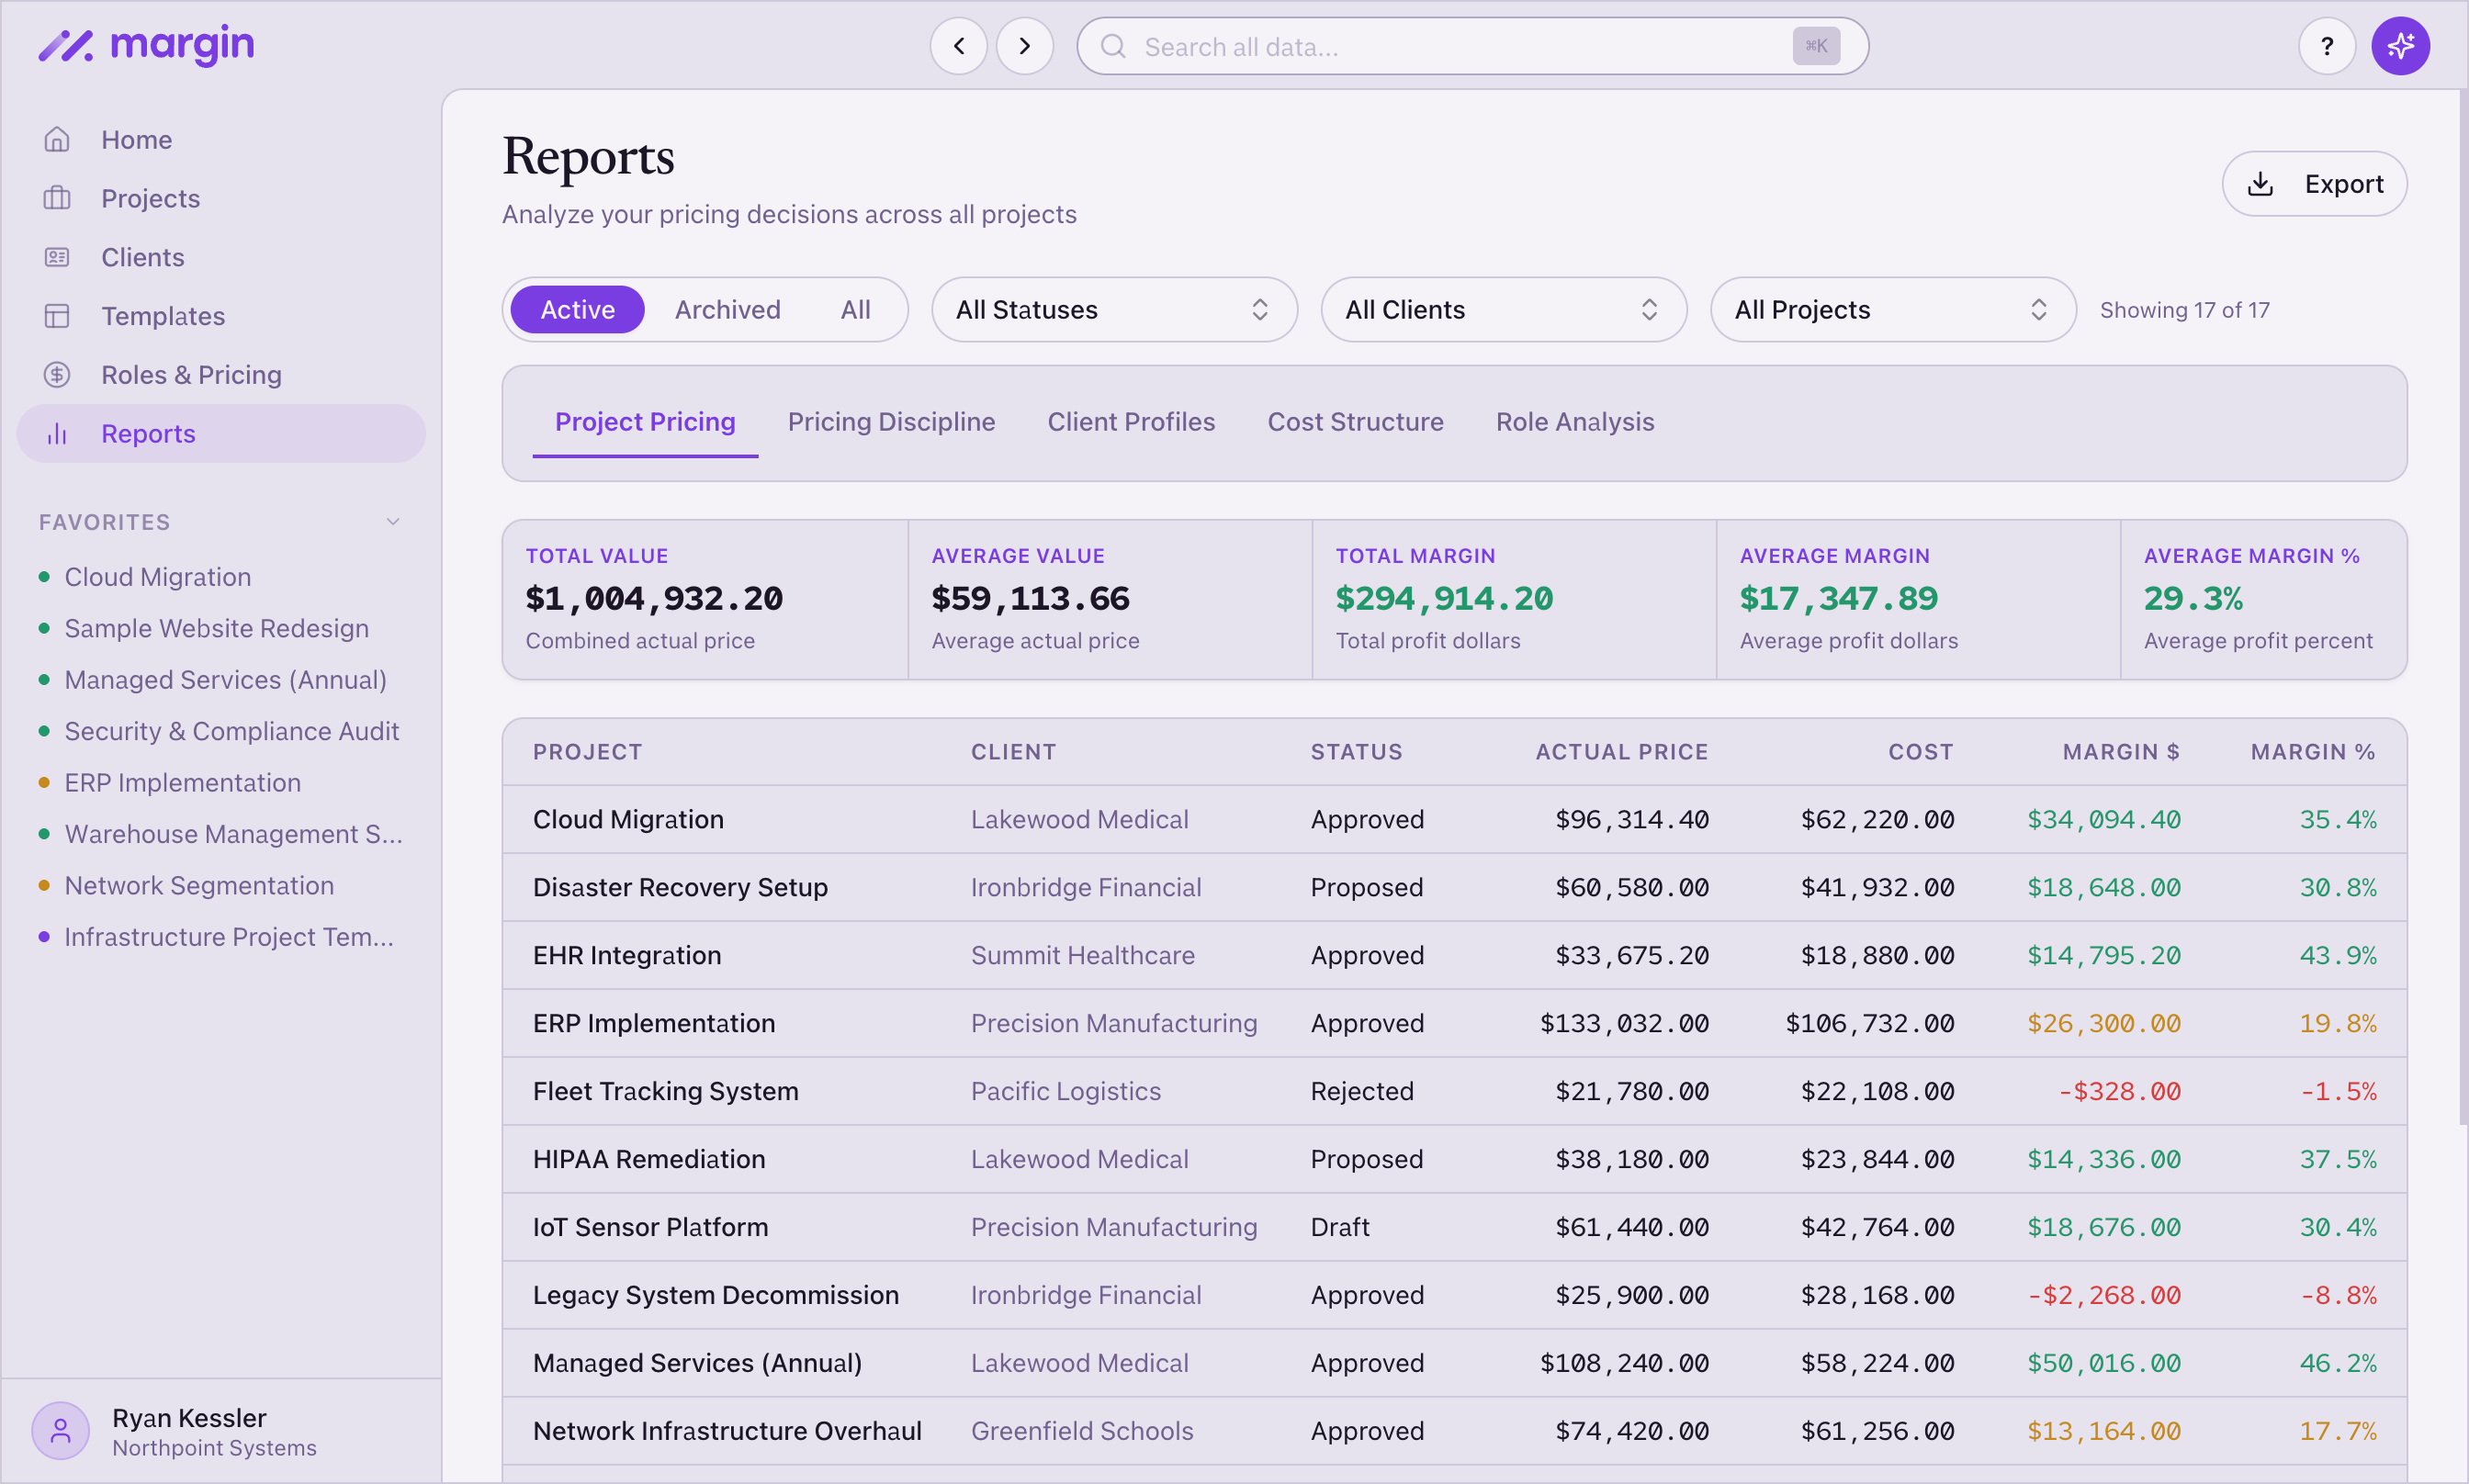
Engagement-level reporting — where you make money, where you don't
Every engagement, every client, every margin %, in one place. In the included sample, Cloud Migration ran 35.4%. A Legacy System Decommission ran -8.8%. A Fleet Tracking proposal came in at -1.5% — and you saw it before it shipped.
Sort by margin, filter by client, export the lot. Renewal conversations stop being guesses.
Price every model on what it actually costs to serve.
See the real cost behind every seat, engagement, and hour — before the contract is signed.
Try Margin free