Know your room to discount before the proposal goes out.
See where the margin comes from, how much you can discount and still hit target, and what to fix when you can't.
Every project, fully accounted for.
Most pricing tools tell you the number. Margin shows you why. Insights breaks down where every dollar of margin comes from, how much room you have to discount, and the specific fixes that get an underpriced project back to target.
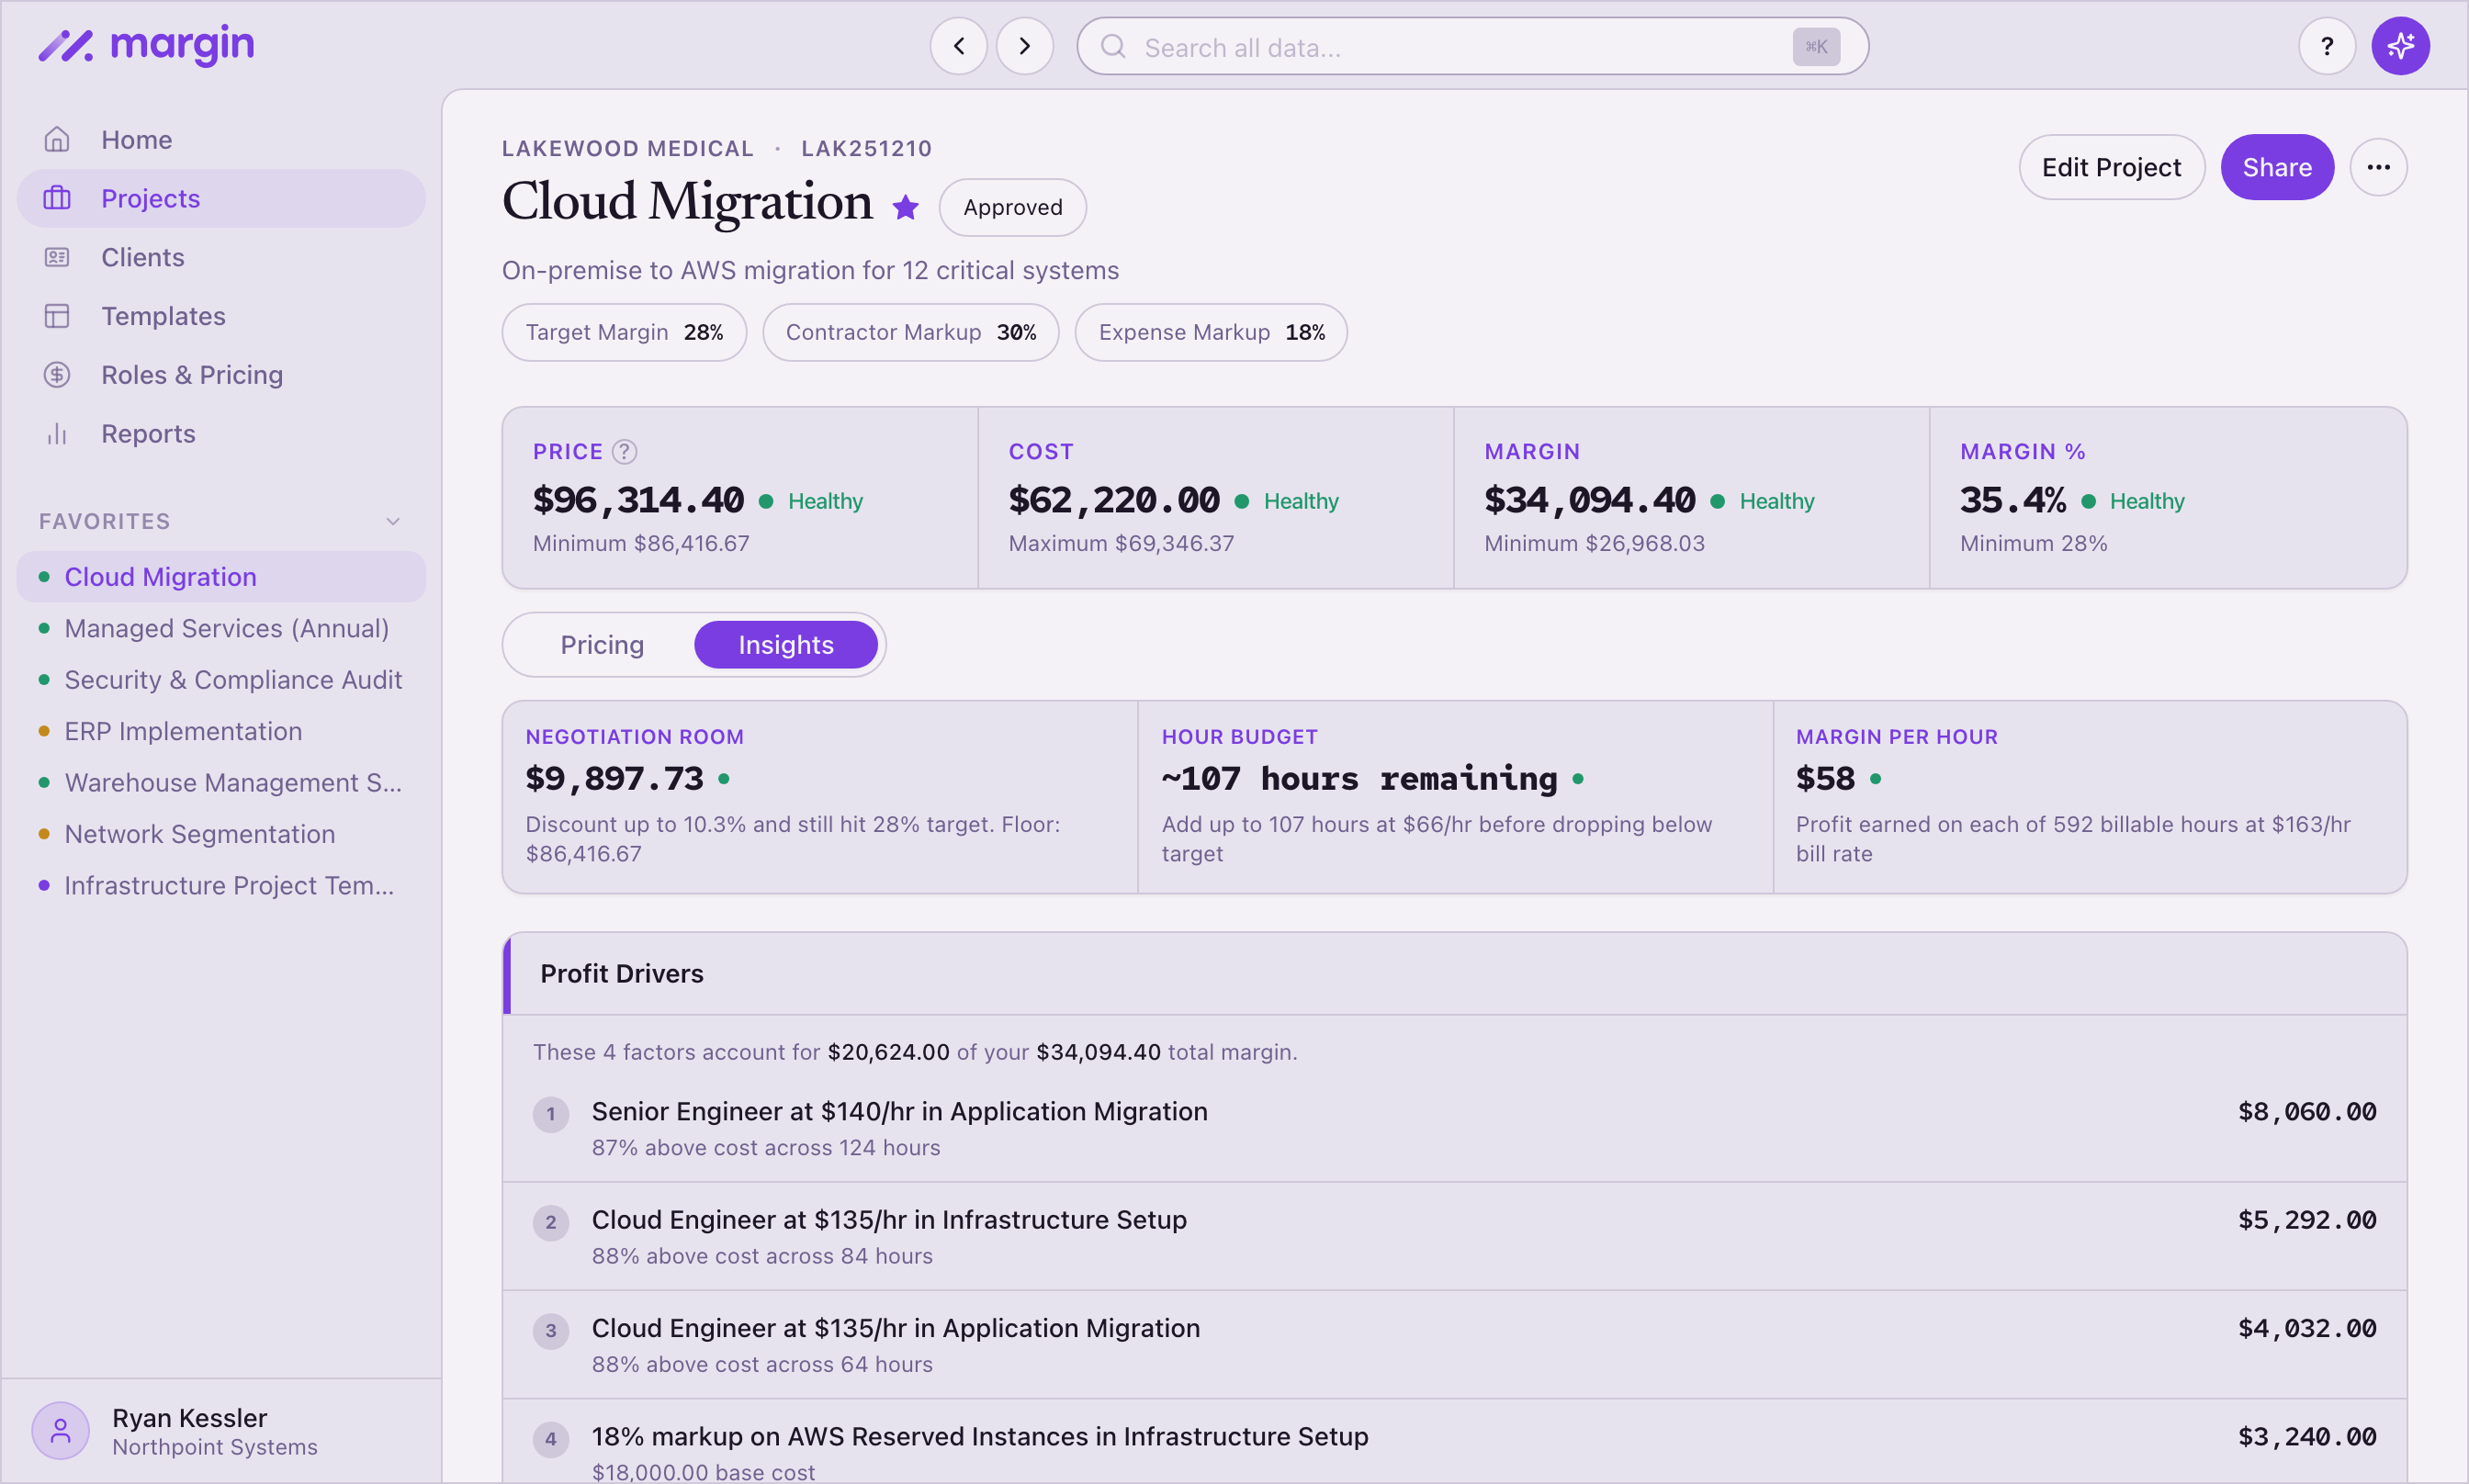
You know the work. Margin handles the math. Open the Insights tab on any project and you see profit drivers, room to discount, risks to watch, and a per-role cost and margin breakdown — before the proposal goes out.
Three things you'll see on every project.
- Profit drivers. The top four contributors to your margin, ranked. "These four factors account for $42,000 of your $58,000 total margin." Each one is a role, a marked-up expense, or a premium-priced override — so you know exactly where the money's coming from.
- Room to discount, or path to target. When the project's healthy, Margin shows how much you can discount and still hit target. "Discount up to 12% and still hit 30%. Floor: $84,200." When it's not, the same panel flips into a step-by-step path to target — ranked fixes with cumulative margin %, like "Raise Senior Designer rate to $185/hr" or "Add 35% markup to subcontractor expenses."
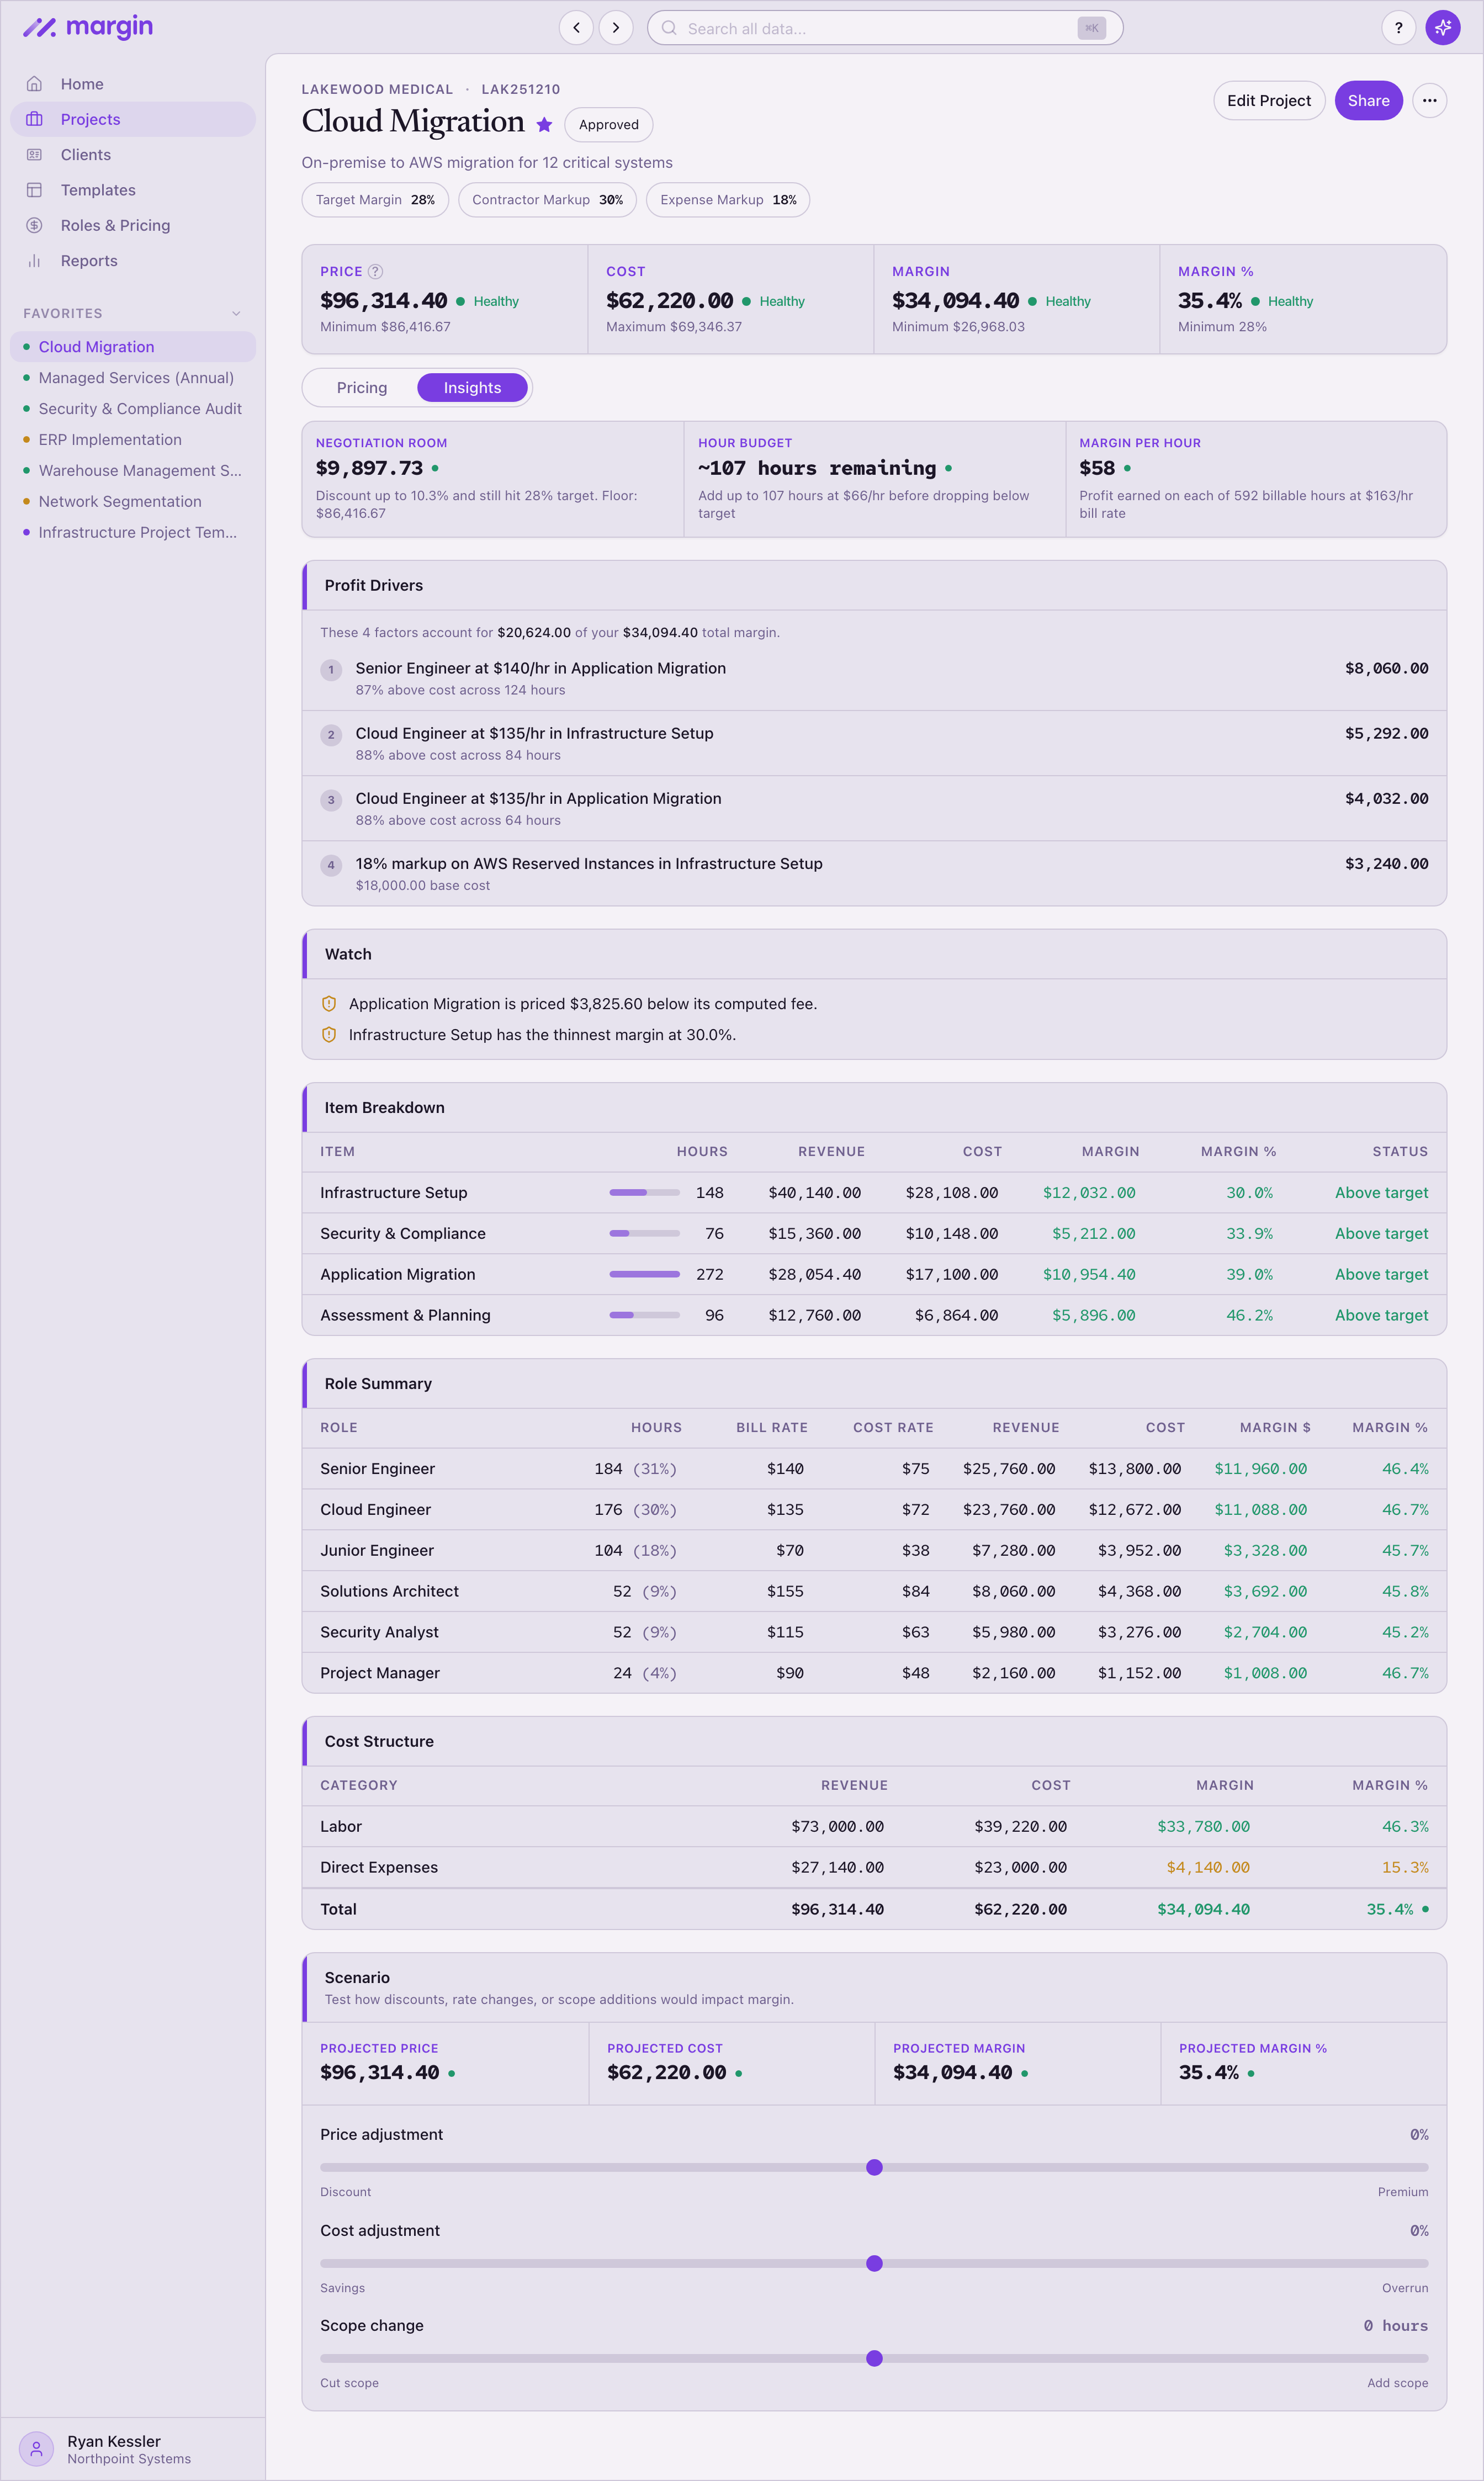
- Risks to watch. Margin scans for the six things that quietly eat margin — roles billed below cost, zero-markup pass-throughs, single line items over 60% of revenue, rates that drift more than 30 points apart, price overrides below cost, and the weakest line on the project. Margin flags them. You decide what to do.
You also see hours left in budget ("~38 hours remaining at $145/hr before you drop below target") and margin per hour ("$62 profit on each of 240 billable hours"). Specific numbers. No interpretation required.
Test the proposal before you send it.
Three sliders. Price up to ±30%. Cost up to ±25%. Scope up to ±40 hours. Drag any of them and four numbers update live — revenue, cost, margin dollars, margin percent — each with a delta from the current price.
So when the client asks for 15% off, you already know what it does to your margin. When the producer flags 20 extra hours, you see whether the project still clears target. The math runs before the conversation, not after.
Per-role cost and margin, line by line.
Every role on the project gets its own row: hours, bill rate, cost rate, revenue, cost, margin in dollars, and margin percent. The same numbers your finance team would pull — without pulling them.
This is how you spot the role that's eating the margin, the role that's carrying the project, and the rate that doesn't line up with the rest. Underneath, a cost summary splits labor, contractors, and direct expenses, so you see where the spend actually sits.
Price faster, more accurately, and know you're profitable before you commit.
Price with the full picture in front of you.
Profit drivers, room to discount, risks to watch, and a live what-if simulator — on every project.
Try Margin free